Every PUT is metered: tuning ClickHouse merges for object storage
A bulk load into our object-storage ClickHouse node left 91 merges running at once, each failing on memory and being picked up again, and on R2 every part a merge writes is a set of metered uploads. Six levers make the node write fewer, larger objects. Each is here with its value, along with the one ClickHouse has retired and the pool settings that let merges finish.
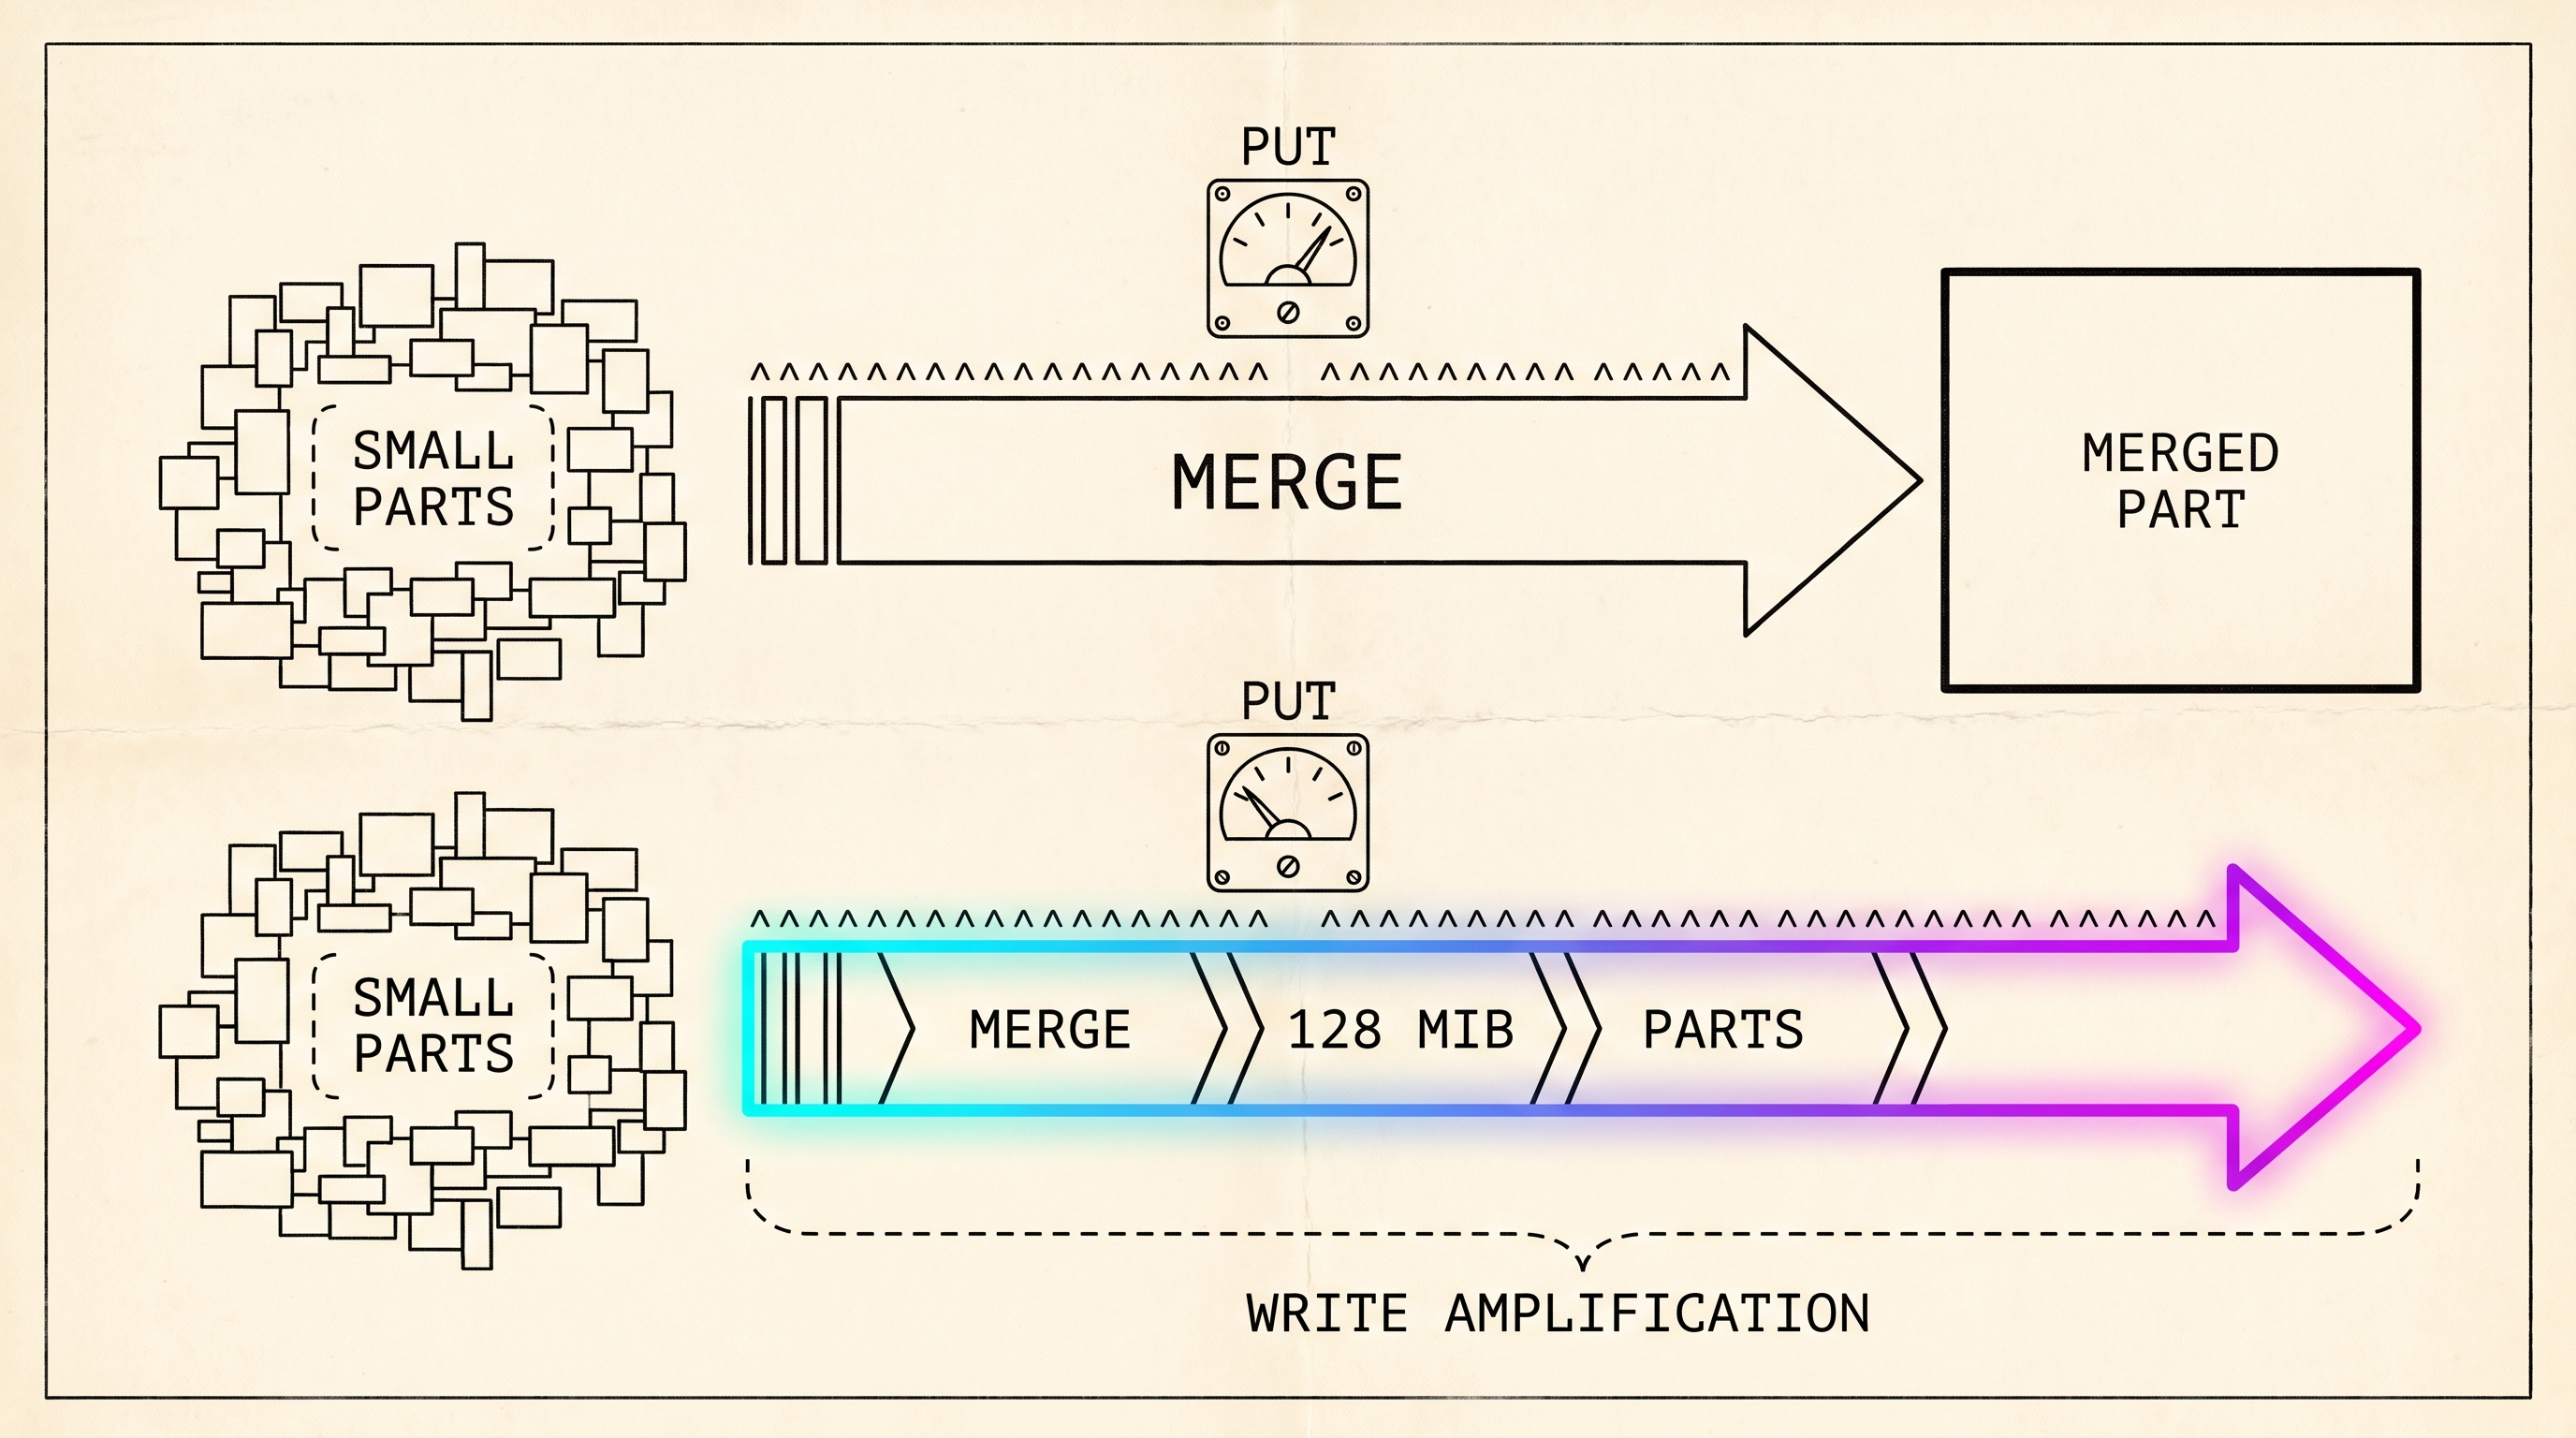
In July we bulk loaded terabytes into our object-storage ClickHouse node, and the merges that followed didn’t settle. The merge log showed 91 running at once, none with enough memory to finish, so they failed, went back on the queue, and failed again. On a local NVMe drive a merge costs disk bandwidth the machine already owns. On Cloudflare R2, every part a merge writes is a set of uploads, and Cloudflare bills Class A operations, the class that includes PutObject and UploadPart, at $4.50 per million (R2 pricing page, updated 2026-08-07). The retries stopped once we capped the number of merges instead of the memory they could use.
We run this on the node the architecture article describes: 32 threads, two NVMe drives, a 1 Gbit port, and a steady daily ingest into day-partitioned tables. The storage configuration printed there carries the four upload settings below.
What a merge is
A MergeTree table never edits a file in place. Each INSERT writes a new part, a directory of column files, marks, checksums and a primary index with rows in primary key order, and parts are immutable. In the background the server picks a few adjacent parts, rewrites them as one larger part, and deletes the originals after a grace period (old_parts_lifetime, eight minutes by default). The merged part then qualifies for the next merge, so a row inserted today gets copied several times as its part grows from a few megabytes to whatever size the settings allow.
The merging is what keeps reads fast, because a query opens one set of files per part.
Every batch of new signals lands as a small bundle of files that never gets edited. To keep queries fast, the database keeps combining small bundles into bigger ones, copying the same data several times over. On a local drive that copying is free. In a bucket every copy is a set of uploads the provider charges for, so how the database packs those bundles decides what the history costs to keep.
What a merge costs on object storage
R2 bills writes per operation, not per byte. Class A covers PutObject, CreateMultipartUpload, UploadPart, CompleteMultipartUpload and ListObjects at $4.50 per million. DeleteObject and AbortMultipartUpload are free (R2 pricing page, updated 2026-08-07). What a merged part costs therefore depends on how many objects it produces and how many pieces each is uploaded in, and configuration sets both.
ClickHouse uploads any file larger than the single-part threshold (s3_max_single_part_upload_size, 32 MiB by default) as a multipart upload, cut into pieces of s3_min_upload_part_size (16 MiB by default), and each piece is one UploadPart call. At the default part size a 5 GB column file takes about 300 UploadPart calls. At 128 MiB parts the same file takes about 40.
A wide part multiplies this again, because it has one data file and one marks file per column, so a 40-column table writes at least 80 objects per part, where a compact part writes two for the whole part.
The six levers
The first lever is part size. We set the upload part to 128 MiB and the single-part threshold to 64 MiB, so a file under 64 MiB goes up as one PutObject and anything larger goes up in 128 MiB pieces. In a disk’s configuration the server reads all four upload settings only under their s3_ names, s3_min_upload_part_size and s3_max_single_part_upload_size included. A key spelled without the prefix is ignored and the default applies. Our own template carried two of the four without the prefix until this review caught it, so the values it intended were not the values in force (ClickHouse source, S3Settings.cpp, read 2026-09-08).
Second, the parts have to be equal. R2’s multipart page says “All parts except the last must be the same size”, and an upload that breaks the rule fails with “InvalidPart: All non-trailing parts must have the same length”. S3 accepts uneven parts, so this is a property of R2. By default ClickHouse doubles the part size every 500 parts (s3_upload_part_size_multiply_factor 2, s3_upload_part_size_multiply_parts_count_threshold 500), so at the 16 MiB starting size any file past about 8 GB gets rejected. Setting the multiply factor to 1 under the unprefixed key changed nothing, and the failures went on until s3_strict_upload_part_size at 128 MiB stopped them. It pins every non-trailing part to that size, and we verified it by reloading a full partition.
The third lever is min_bytes_for_wide_part, which we set to 512 MiB, up from the 10 MiB default, so a part stays compact until a merge takes it past that size. Its companion min_rows_for_wide_part defaults to 0, so bytes alone decide the format. Fresh parts from the ingest are all smaller than 512 MiB, so on a 40-column table a fresh part is two data objects instead of 80 or more.
The merge cap comes fourth. max_bytes_to_merge_at_max_space_in_pool is 50 GiB, down from the default of 150 GiB. At the default the largest merges rewrite up to 150 GiB at a time for almost no query gain, since the per-part overhead of a scan is small next to 50 GiB of column data. With the cap, a byte is uploaded once at insert and copied one to one and a half more times as its part climbs to the ceiling, which puts the design target for write amplification at 2 to 2.5x.
Partition granularity is the fifth. Parts never merge across partitions, and a partition is also the unit of expiry. A monthly partition holds about thirty days of parts where a daily one holds one, so the floor on the part count falls by that factor and expiry coarsens to the month. Ours are daily, so expiry stays at day granularity and the merge cap sets the part count.
The last one is ttl_only_drop_parts, set to 1. A TTL then removes a part only when every row in it has expired, which with day partitions means a whole day goes at once, as DeleteObject calls that cost nothing. With it off, the TTL rewrites every part holding an expired row, and each rewrite is a metered upload.
A seventh lever, send_metadata, kept a copy of the disk’s metadata in the bucket until ClickHouse removed it in 25.7 because it “wasn’t ever used and nobody supports this code” (PR 82508, merged 2025-06-25). Our block no longer carries the line.
The settings as one block
<clickhouse>
  <storage_configuration>
    <disks>
      <s3_main>
        <type>s3</type>
        <!-- endpoint, credentials and metadata_path as in the storage config
             of the architecture article -->
        <s3_min_upload_part_size>134217728</s3_min_upload_part_size>
        <s3_max_single_part_upload_size>67108864</s3_max_single_part_upload_size>
        <s3_upload_part_size_multiply_factor>1</s3_upload_part_size_multiply_factor>
        <s3_strict_upload_part_size>134217728</s3_strict_upload_part_size>
      </s3_main>
    </disks>
  </storage_configuration>
  <merge_tree>
    <min_bytes_for_wide_part>536870912</min_bytes_for_wide_part>
    <max_bytes_to_merge_at_max_space_in_pool>53687091200</max_bytes_to_merge_at_max_space_in_pool>
    <ttl_only_drop_parts>1</ttl_only_drop_parts>
  </merge_tree>
  <background_pool_size>8</background_pool_size>
  <background_merges_mutations_concurrency_ratio>2</background_merges_mutations_concurrency_ratio>
  <merges_mutations_memory_usage_to_ram_ratio>0.5</merges_mutations_memory_usage_to_ram_ratio>
</clickhouse>
The merge_tree block applies to every table on the server. The last three lines are the merge pool, and we set them after the bulk load.
The merge pool after a bulk load
When the bulk load’s inserts stopped, hundreds of merges were running or queued, holding more memory together than the merge budget. Queries that needed memory failed with total-memory errors. Point reads, which need almost none, kept answering.
Our first change bounded the memory. We set merges_mutations_memory_usage_to_ram_ratio to 0.4, which puts the merge budget at 40 percent of RAM, and raised the background pool to 24 threads, with the concurrency ratio still at 4, which allowed up to 96 merges at once. That budget is a soft limit. Once merges together reach it, the server schedules no new ones and keeps executing the ones already scheduled (server settings reference, merges_mutations_memory_usage_soft_limit, read 2026-09-08). Queries got their memory back, but the merges kept failing, and the log then recorded 91 in flight, each going back on the queue after a memory error.
Then we cut the concurrency. background_pool_size is now 8 and background_merges_mutations_concurrency_ratio is 2, so at most 16 merges run at once, and with the memory ratio back at 0.5 those sixteen share half the RAM. Each one finished, and the queue drained.
After a big load the database had a backlog of that combining to do, and it tried to run too much of it at once. The memory ran out, the jobs failed part way through, and the same jobs came straight back and failed again. Capping the memory didn’t stop that, because the cap only keeps new jobs from starting. Capping how many run at the same time did, and the backlog cleared.
The two tradeoffs
A merge cap raises the part count, because parts stop merging at 50 GiB instead of growing to the size of the partition. More parts means a scan opens more files, holds more marks in the mark cache, and issues more range requests on a cold read. We expect that to be small on the narrow signals tables and haven’t measured it on the wide crawled-pages table.
Compact parts have a read cost of their own. A query that needs three columns reads three files from a wide part, but in a compact part every column shares one data file, so on object storage it fetches most of the part to read three columns out of forty. Once cached the difference disappears, but the first read is slower. We accepted that on fresh parts for the lower object count, because any merge past 512 MiB produces a wide part, and the large parts where a scan spends its time are all wide.
Measuring write amplification
system.events counts WriteBufferFromS3Bytes, every byte the server has uploaded, and system.metric_log samples that counter as a per-interval increment. system.part_log records every part an insert created, with its size on disk in size_in_bytes. Bytes uploaded over a window, divided by the bytes of new parts in the same window, is the amplification. Well above the target means a merge is rewriting more than the cap intends or a row-level TTL is rewriting parts. The query below does the arithmetic, and its output row is illustrative, since we haven’t run it on the node yet.
-- Write amplification over the last 24 hours, object-storage disks only
WITH
  (SELECT sum(ProfileEvent_WriteBufferFromS3Bytes)
   FROM system.metric_log
   WHERE event_time > now() - INTERVAL 24 HOUR) AS uploaded,
  (SELECT sum(size_in_bytes)
   FROM system.part_log
   WHERE event_type = 'NewPart'
     AND disk_name LIKE 's3%'
     AND event_time > now() - INTERVAL 24 HOUR) AS inserted
SELECT
  formatReadableSize(uploaded) AS uploaded,
  formatReadableSize(inserted) AS inserted,
  round(uploaded / inserted, 2) AS amplification;

-- ┌─uploaded─┬─inserted─┬─amplification─┐
-- │ ...      │ ...      │          2.xx │
-- └──────────┴──────────┴───────────────┘
The bucket’s own operation counts are the other half. Cloudflare exposes them through its GraphQL analytics, and we’re building an exporter that polls it.
Checking one merge yourself
Insert a few batches into a small table on the object-storage policy, snapshot the S3 counters, force a merge, and read the difference. The output under the query is illustrative, the shape to expect for a merged part of a few hundred megabytes under the block above.
-- 1. Snapshot the upload counters
CREATE TEMPORARY TABLE before AS
SELECT event, value FROM system.events
WHERE event LIKE 'S3%' OR event LIKE 'WriteBufferFromS3%';

-- 2. Force one merge of every part into one
OPTIMIZE TABLE lab.events FINAL;

-- 3. The delta is the cost of that merge
SELECT e.event, e.value - b.value AS delta
FROM system.events AS e
JOIN before AS b USING (event)
WHERE delta > 0
ORDER BY event;

-- ┌─event─────────────────────┬─delta─┐
-- │ S3CompleteMultipartUpload │     1 │   one data file over 64 MiB
-- │ S3CreateMultipartUpload   │     1 │
-- │ S3PutObject               │     9 │   marks, checksums, index, the small files
-- │ S3UploadPart              │     3 │   the data file in 128 MiB pieces
-- │ S3WriteRequestsCount      │    14 │
-- │ WriteBufferFromS3Bytes    │   ... │   the merged part's size on disk
-- └───────────────────────────┴───────┘
S3UploadPart should equal the data file size divided by the part size, rounded up. If S3PutObject grows with your column count, the merged part is wide and min_bytes_for_wide_part is below the size it reached. The S3DeleteObjects rows that follow when old_parts_lifetime expires are free.
The pool settings are one query away. The rows below are the values from the block, not a capture from the node, and running merges should never exceed the product of the first two.
SELECT name, value FROM system.server_settings
WHERE name IN ('background_pool_size',
               'background_merges_mutations_concurrency_ratio',
               'merges_mutations_memory_usage_to_ram_ratio');

-- ┌─name──────────────────────────────────────────┬─value─┐
-- │ background_merges_mutations_concurrency_ratio │ 2     │
-- │ background_pool_size                          │ 8     │
-- │ merges_mutations_memory_usage_to_ram_ratio    │ 0.5   │
-- └───────────────────────────────────────────────┴───────┘

SELECT count() AS running FROM system.merges;
-- never above 16 on this configuration
Still open
We haven’t measured the write amplification. The 2 to 2.5x above is what the settings imply, and the bucket’s own number waits on the exporter. We also don’t know whether the 50 GiB merge cap slows scans on the wide crawled-pages table. That needs a scan of one partition at both settings.
Further reading
- Cloudflare, R2 pricing: operation classes and free operations.
- Cloudflare, Multipart upload: the equal part size rule.
- ClickHouse, Core settings: the
s3_upload settings. - ClickHouse, MergeTree settings: the three
merge_treesettings above. - ClickHouse, External disks: the s3 disk parameters.
- ClickHouse, Server settings: the merge pool and the memory soft limit.
- ClickHouse, PR 82508: the removal of
send_metadatain 25.7.
On object storage every rewrite is billed, so limit how much a merge rewrites rather than how much memory it may use.